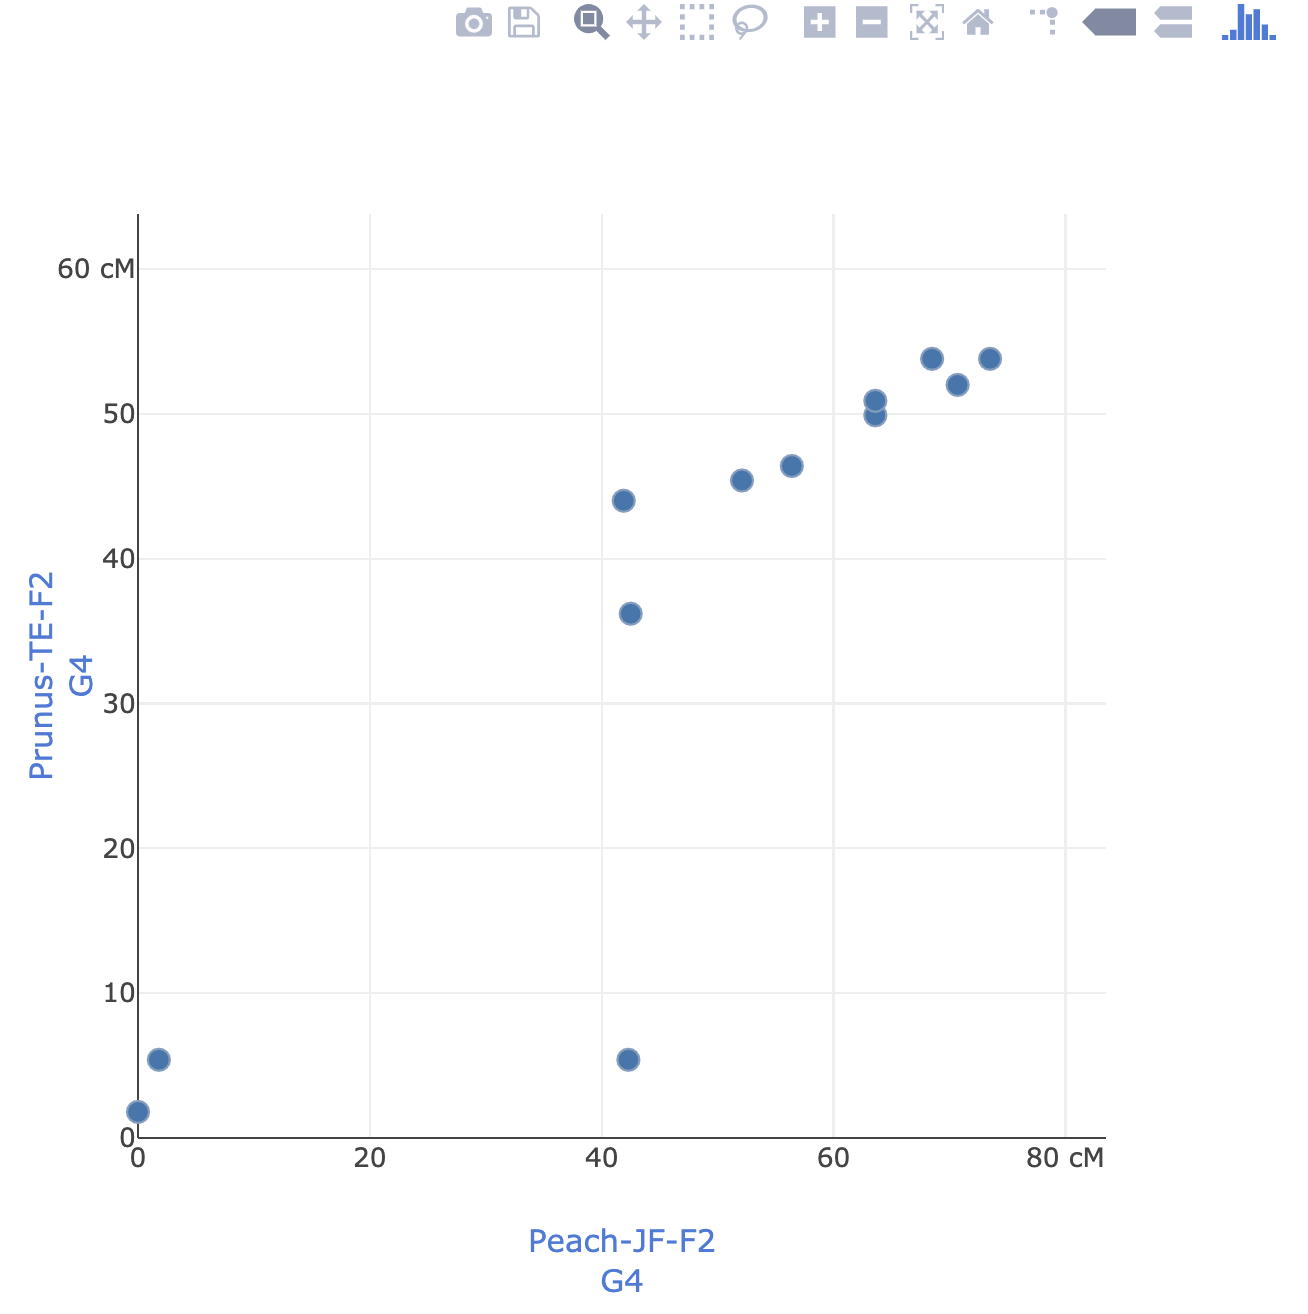
The Dot plot provides a more comprehensive representation of where correspondences exist across multiple maps and organisms and between maps and genomes. This feature shows the relative positions of common markers and clicking on a map point will open the corresponding page for that marker.

