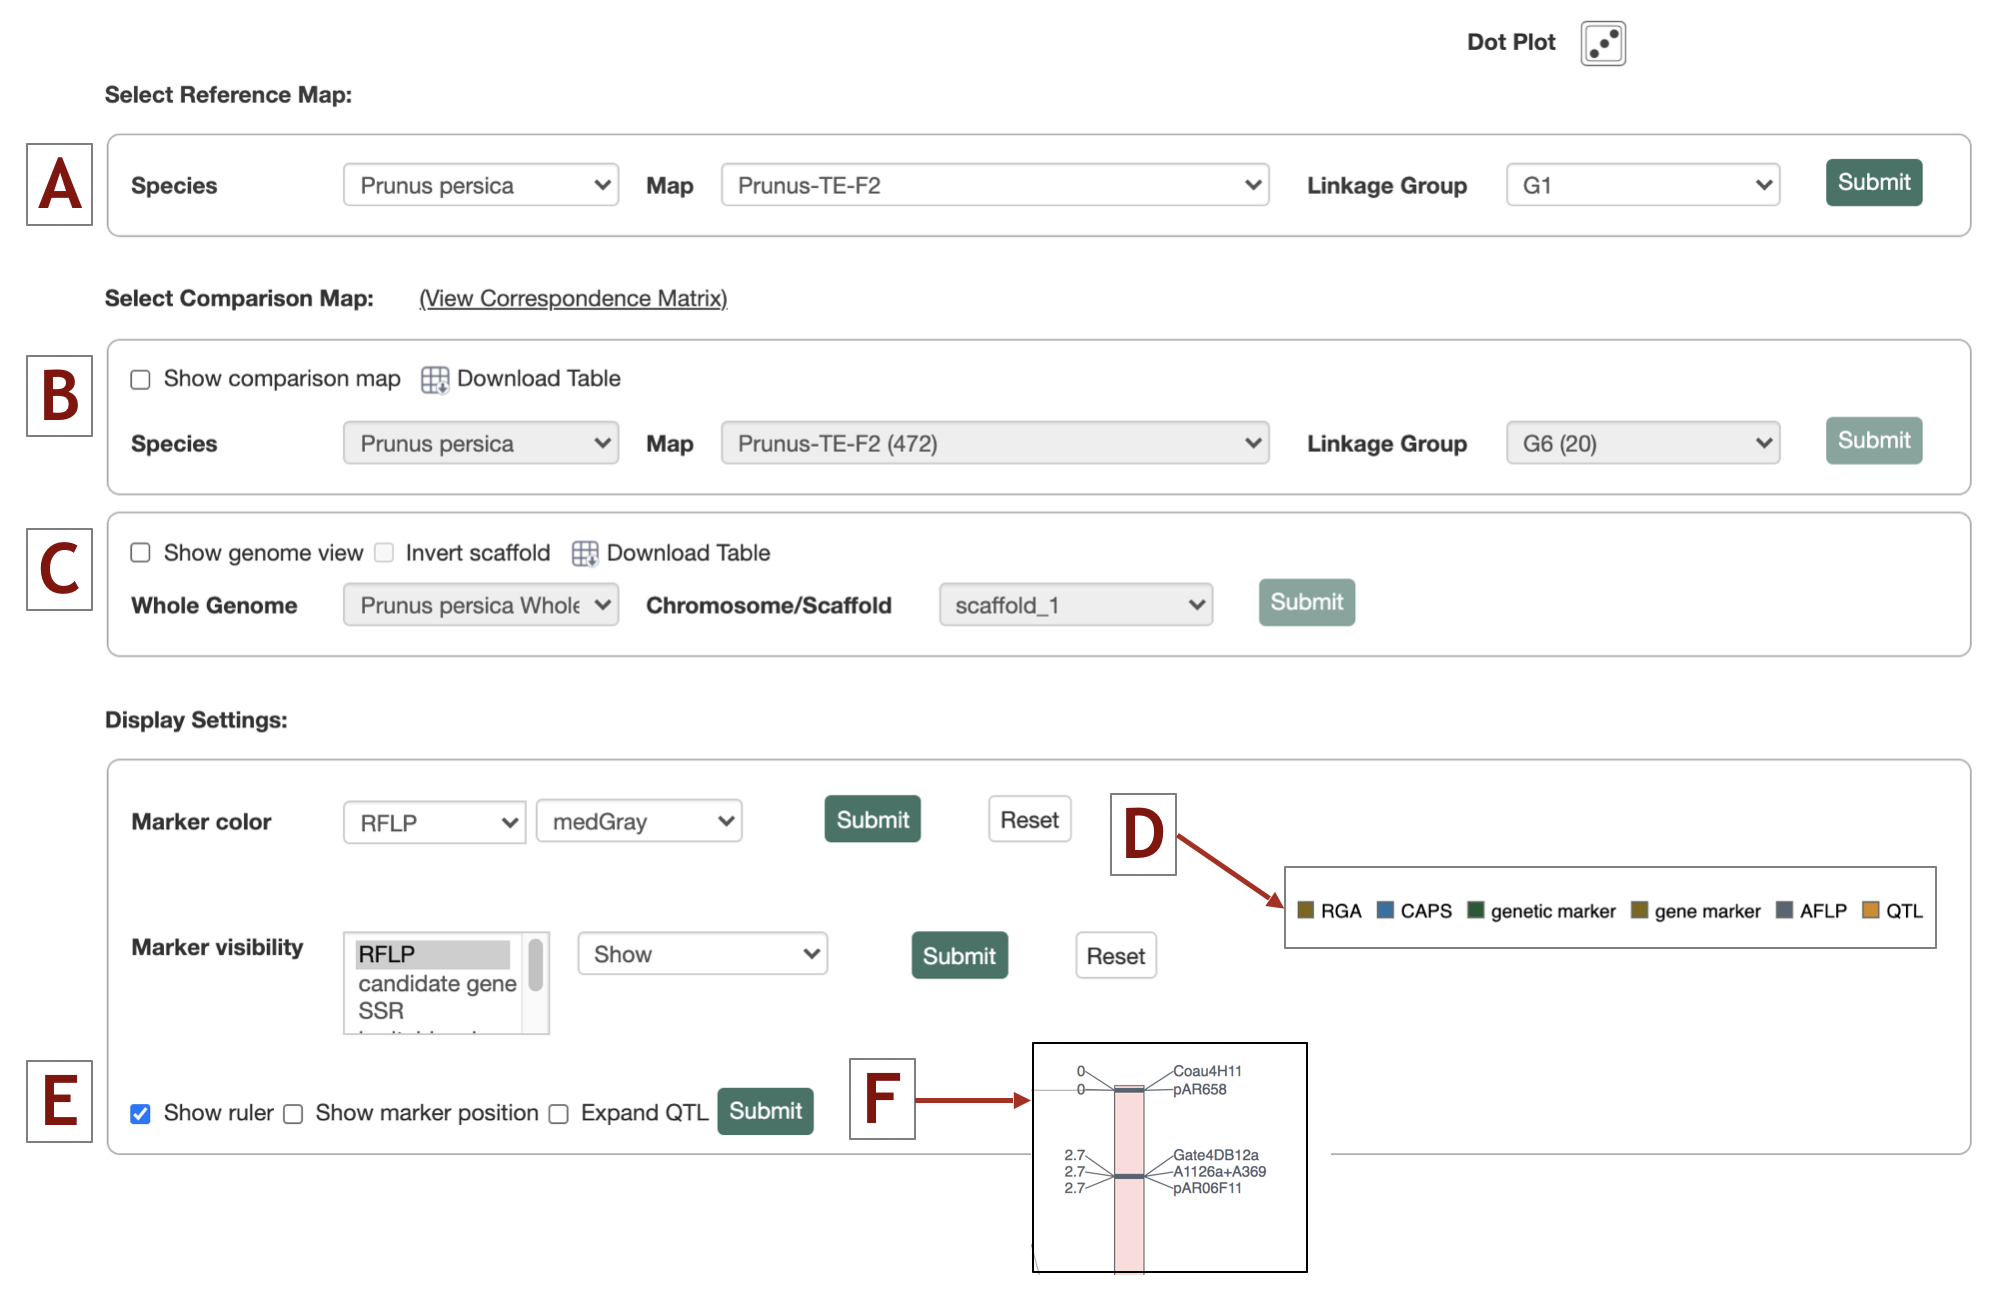
Below the linkage groups on the MapViewer page, the Control Panel is used to configure which linkage groups and chromosome/scaffold are displayed as well as their viewing options. Different reference and comparison maps (A,B) and maps and genomes (A,C) can be selected along with their downloadable table for marker correspondence for genetic maps, B, and genomes, C. Configuration options are available for marker and QTL display patterns and visibility and change color display of different marker types (D,E,F).
The ruler and marker positions can be toggled on or off (E,F). In the checked or 'on' position, each marker displays its own marker position label. The expand QTL option allows QTL labels to directly follow their QTL lane, rather than in a single vertical column following all QTL lanes. To display the changes press Submit.

